library(EDCimport)
library(flextable)
# tm = read_trialmaster("path/to/file.zip")
tm = edc_example_ae()
load_list(tm)

head(ae)
#> # A tibble: 6 × 6
#>   subjid aesoc                                          aegr  n_ae sae   crfname
#>    <int> <chr>                                         <int> <int> <lgl> <chr>
#> 1      1 Nervous system disorders                          3     2 FALSE ae
#> 2      1 Injury, poisoning and procedural complicatio…     1     2 FALSE ae
#> 3      2 Hepatobiliary disorders                           1     2 TRUE  ae
#> 4      2 Injury, poisoning and procedural complicatio…     2     2 FALSE ae
#> 5      3 Blood and lymphatic system disorders              4     3 FALSE ae
#> 6      3 Injury, poisoning and procedural complicatio…     5     3 FALSE ae
head(enrolres)
#> # A tibble: 6 × 3
#>   subjid arm   crfname
#>    <int> <chr> <chr>
#> 1      1 Trt   enrolres
#> 2      2 Trt   enrolres
#> 3      3 Trt   enrolres
#> 4      4 Trt   enrolres
#> 5      5 Ctl   enrolres
#> 6 6 Ctl enrolresOn commence par charger la base TrialMaster comme on fait d’habitude. Ici j’utilise la fonction edc_example_ae() pour ne pas dépendre de données réelles privées.
Macro AE_grades
La macro AE_grades est traduite en deux fonctions : ae_table_grade_max() et ae_table_grade_n(). Ces fonctions retournent des objets de classe crosstable. Ils ont une méthode as_flextable qui les transforme en table HTML de classe flextable.
EDCimport comprend aussi la fonction ae_plot_grade_max()
Voir la description du package crosstable pour plus d’informations: documentation.
Voir la description du package flextable pour la liste des modificateurs (comme add_footer_lines()) : documentation.
Tableaux
Table des grades maximum par patient stratifié sur le bras
On pourrait retrouver exactement la sortie SAS en mettant total=FALSE.
ae_table_grade_max(df_ae=ae, df_enrol=enrolres, arm="arm") %>%
  as_flextable() %>%
  add_footer_lines("Percentages are given as the proportion of patients presenting at most one AE of given grade")
label |
variable |
arm_ |
Total |
|
|---|---|---|---|---|
Ctl |
Trt |
|||
Max grade |
Grade 1 |
3 (11%) |
1 (4%) |
4 (8%) |
Grade 2 |
5 (19%) |
5 (22%) |
10 (20%) |
|
Grade 3 |
10 (37%) |
8 (35%) |
18 (36%) |
|
Grade 4 |
8 (30%) |
1 (4%) |
9 (18%) |
|
Grade 5 |
1 (4%) |
5 (22%) |
6 (12%) |
|
No AE |
0 (0%) |
3 (13%) |
3 (6%) |
|
Total |
27 (54%) |
23 (46%) |
50 (100%) |
|
Percentages are given as the proportion of patients presenting at most one AE of given grade | ||||
Table de tous les grades pour chaque patient
ae_table_grade_n(df_ae=ae, df_enrol=enrolres, arm=NULL) %>%
  as_flextable() %>%
  add_footer_lines("Percentages are given as the proportion of patients presenting at least one AE of given grade")
label |
variable |
Treatment arm |
|---|---|---|
All patients | ||
grade |
Grade 1 |
28 (56%) |
Grade 2 |
25 (50%) |
|
Grade 3 |
27 (54%) |
|
Grade 4 |
11 (22%) |
|
Grade 5 |
6 (12%) |
|
Percentages are given as the proportion of patients presenting at least one AE of given grade | ||
On pourrait retrouver exactement la sortie SAS en mettant total=FALSE.
ae_table_grade_n(df_ae=ae, df_enrol=enrolres, arm="arm") %>%
  as_flextable() %>%
  add_footer_lines("Percentages are given as the proportion of patients presenting at least one AE of given grade")
label |
variable |
arm |
|
|---|---|---|---|
Ctl |
Trt |
||
grade |
Grade 1 |
15 (56%) |
13 (57%) |
Grade 2 |
17 (63%) |
8 (35%) |
|
Grade 3 |
14 (52%) |
13 (57%) |
|
Grade 4 |
8 (30%) |
3 (13%) |
|
Grade 5 |
1 (4%) |
5 (22%) |
|
Percentages are given as the proportion of patients presenting at least one AE of given grade | |||
Table des grades maximum par patient, filtrée sur les SAE
La fonction ne prend pas en charge les SAE directement, il suffit de filtrer la table AE en amont.
ae %>%
  dplyr::filter(sae==TRUE) %>%
  ae_table_grade_max(df_enrol=enrolres, arm=NULL) %>%
  as_flextable() %>%
  add_footer_lines("Percentages are given as the proportion of patients presenting at most one SAE of given grade")
label |
variable |
value |
|---|---|---|
Max grade |
Grade 1 |
4 (8%) |
Grade 2 |
3 (6%) |
|
Grade 3 |
2 (4%) |
|
Grade 4 |
2 (4%) |
|
Grade 5 |
1 (2%) |
|
No AE |
38 (76%) |
|
Total |
50 (100%) |
|
Percentages are given as the proportion of patients presenting at most one SAE of given grade | ||
Sorties Plots
ae_plot_grade_n(df_ae=ae, df_enrol=enrolres)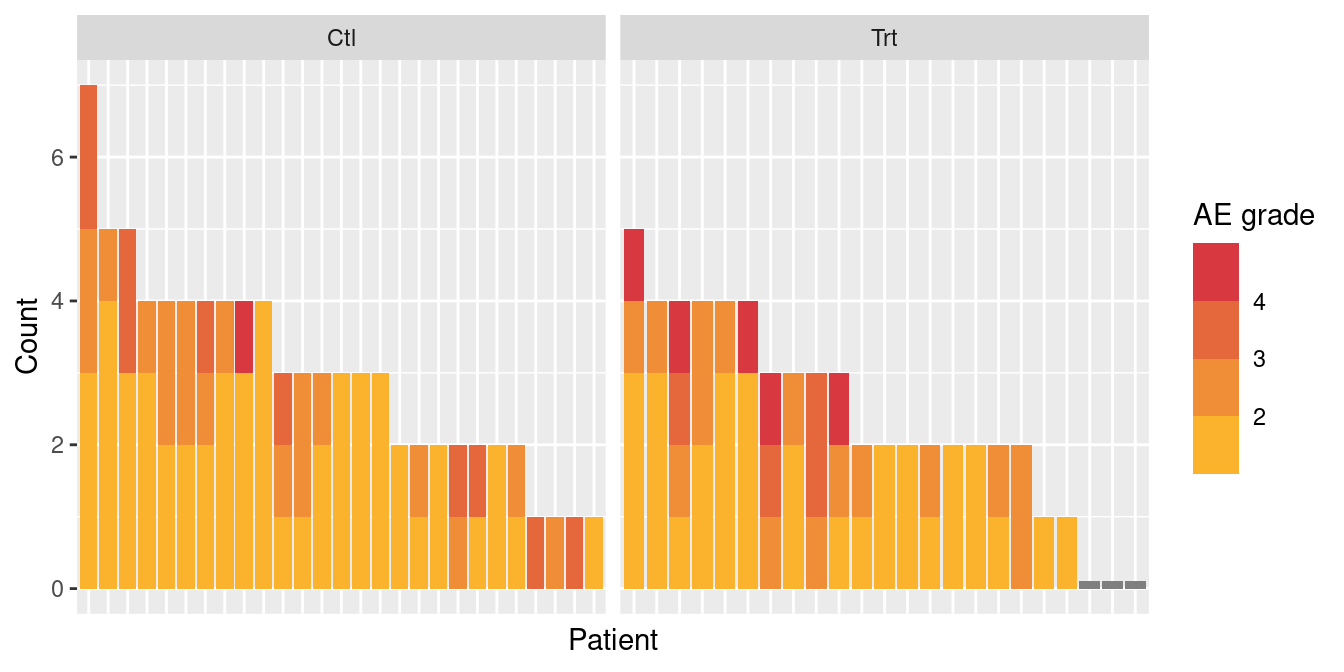
Macro AE_SOC
La macro AE_SOC est traduite en la fonctions : ae_table_soc(). Cette fonction retourne des objets de classe ae_table_soc. Ils ont également une méthode as_flextable qui les transforme en table HTML de classe flextable, mais différente de celle de crosstable.
Voir la description du package flextable pour la liste des modificateurs (comme add_footer_lines()) : documentation.
Pour les sorties sur officer, comme ces tables sont très larges, pensez bien à basculer en format paysage en utilisant officer::body_end_section_continuous(), puis officer::body_end_section_landscape() pour revenir au format portrait.
Tableaux
Table des grades par soc et termes
##TODO exemple avec des TERMSable des grades par termes uniquement, filtrée sur les SAE
##TODO ajouter vrais SAETable des grades stratifiée sur le bras (sans colonne total)
On peut ajouter total=FALSE pour retirer la colonne “Tot” et obtenir la sortie AE_SOC5.
ae_table_soc(df_ae=ae, df_enrol=enrolres, term=NULL, arm="arm", sort_by_ae=FALSE) %>%
  as_flextable() %>%
  add_footer_lines("In the header, N represents the number of patients.") %>%
  add_footer_lines("Percentages are given as the proportion of patients presenting at least one AE of given grade")
Ctl (N=27) |
Trt (N=23) |
|||||||||||
|---|---|---|---|---|---|---|---|---|---|---|---|---|
CTCAE SOC |
G1 |
G2 |
G3 |
G4 |
G5 |
Tot |
G1 |
G2 |
G3 |
G4 |
G5 |
Tot |
Blood and lymphatic system disorders |
2 (7%) |
1 (4%) |
3 (11%) |
1 (4%) |
1 (4%) |
2 (9%) |
||||||
Cardiac disorders |
1 (4%) |
1 (4%) |
1 (4%) |
1 (4%) |
4 (15%) |
1 (4%) |
1 (4%) |
|||||
Ear and labyrinth disorders |
1 (4%) |
1 (4%) |
1 (4%) |
1 (4%) |
1 (4%) |
2 (9%) |
5 (22%) |
|||||
Endocrine disorders |
3 (11%) |
1 (4%) |
4 (15%) |
|||||||||
Eye disorders |
2 (7%) |
2 (7%) |
1 (4%) |
5 (19%) |
1 (4%) |
1 (4%) |
2 (9%) |
|||||
Gastrointestinal disorders |
2 (7%) |
1 (4%) |
1 (4%) |
4 (15%) |
1 (4%) |
1 (4%) |
||||||
General disorders and administration site conditions |
3 (11%) |
1 (4%) |
4 (15%) |
1 (4%) |
1 (4%) |
|||||||
Hepatobiliary disorders |
2 (7%) |
1 (4%) |
3 (11%) |
2 (9%) |
1 (4%) |
1 (4%) |
4 (17%) |
|||||
Immune system disorders |
1 (4%) |
1 (4%) |
1 (4%) |
3 (11%) |
1 (4%) |
1 (4%) |
||||||
Infections and infestations |
2 (7%) |
2 (7%) |
1 (4%) |
5 (19%) |
1 (4%) |
1 (4%) |
2 (9%) |
|||||
Injury, poisoning and procedural complications |
1 (4%) |
1 (4%) |
1 (4%) |
3 (11%) |
3 (13%) |
1 (4%) |
1 (4%) |
1 (4%) |
6 (26%) |
|||
Investigations |
1 (4%) |
1 (4%) |
1 (4%) |
3 (11%) |
1 (4%) |
1 (4%) |
2 (9%) |
|||||
Metabolism and nutrition disorders |
1 (4%) |
1 (4%) |
||||||||||
Musculoskeletal and connective tissue disorders |
1 (4%) |
1 (4%) |
2 (7%) |
2 (9%) |
1 (4%) |
3 (13%) |
||||||
Neoplasms benign, malignant and unspecified (incl cysts and polyps) |
2 (7%) |
1 (4%) |
3 (11%) |
2 (9%) |
2 (9%) |
1 (4%) |
5 (22%) |
|||||
Nervous system disorders |
1 (4%) |
1 (4%) |
3 (11%) |
5 (19%) |
3 (13%) |
3 (13%) |
||||||
Psychiatric disorders |
1 (4%) |
1 (4%) |
1 (4%) |
3 (11%) |
1 (4%) |
1 (4%) |
2 (9%) |
|||||
Renal and urinary disorders |
1 (4%) |
1 (4%) |
1 (4%) |
3 (11%) |
||||||||
Reproductive system and breast disorders |
2 (7%) |
4 (15%) |
6 (22%) |
|||||||||
Respiratory, thoracic and mediastinal disorders |
2 (7%) |
1 (4%) |
1 (4%) |
4 (15%) |
2 (9%) |
2 (9%) |
||||||
Skin and subcutaneous tissue disorders |
1 (4%) |
1 (4%) |
2 (7%) |
2 (9%) |
2 (9%) |
1 (4%) |
5 (22%) |
|||||
Surgical and medical procedures |
1 (4%) |
1 (4%) |
2 (7%) |
2 (9%) |
1 (4%) |
3 (13%) |
||||||
Vascular disorders |
1 (4%) |
2 (7%) |
3 (11%) |
1 (4%) |
1 (4%) |
2 (9%) |
||||||
In the header, N represents the number of patients. | ||||||||||||
Percentages are given as the proportion of patients presenting at least one AE of given grade | ||||||||||||
Table des soc et termes tous grades confondus stratifiée sur le bras
##TODO