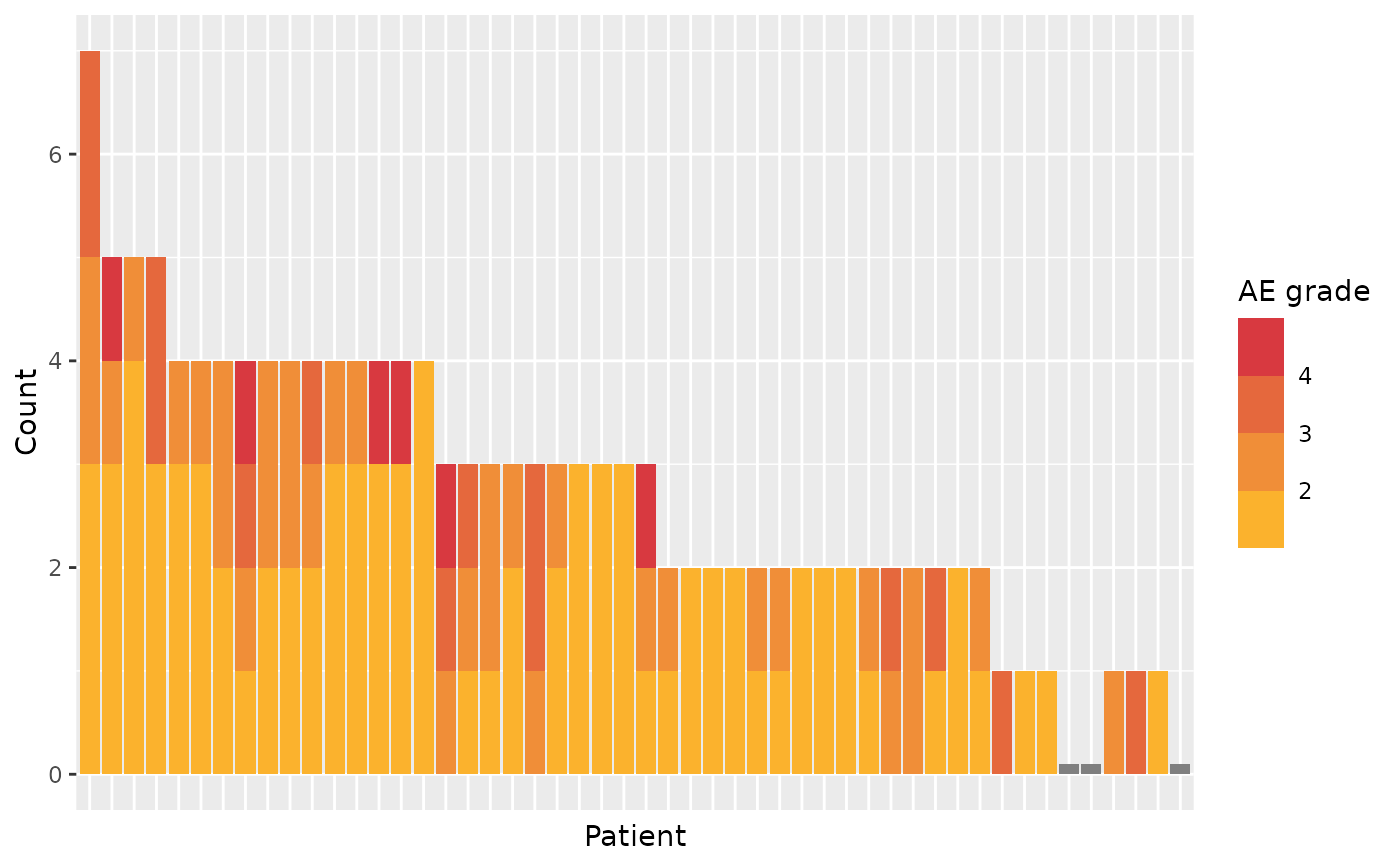
Produce a graphic representation of AE, counting AE as bars for each patient, colored by grade. Can be faceted by treatment arm.
Usage
ae_plot_grade_n(
  df_ae,
  ...,
  df_enrol,
  low = "#ffc425",
  high = "#d11141",
  arm = "ARM",
  grade = "AEGR",
  subjid = "SUBJID"
)
Arguments
- df_ae
adverse event dataset, one row per AE, containing subjid, soc, and grade
- ...
unused
- df_enrol
enrollment dataset, one row per patient, containing subjid (and arm if needed). All patients should be in this dataset.
- low
the color of Grade 1 AE
- high
the color of Grade 5 AE
- arm
name of the treatment column in
df_enrol. Case-insensitive. Can be set toNULLto not group.- grade
name of the AE grade column in
df_ae. Case-insensitive.- subjid
name of the patient ID in both
df_aeanddf_enrol. Case-insensitive.
See also
ae_table_grade_max(), ae_table_grade_n(), ae_table_soc(), ae_plot_grade_max(), ae_plot_grade_n()
Examples
tm = edc_example_ae()
#> Warning: Option "edc_lookup" has been overwritten.
ae_plot_grade_n(df_ae=tm$ae, df_enrol=tm$enrolres)

ae_plot_grade_n(df_ae=tm$ae, df_enrol=tm$enrolres, arm=NULL)