Join all tables on id with only date columns to build a ggplot (or a
plotly if plotly=TRUE) showing all dates for each subject.
This allows outliers to be easily identified.
Usage
edc_swimmerplot(
  ...,
  include = NULL,
  exclude = NULL,
  group = NULL,
  origin = NULL,
  data_list = get_datasets(),
  id_subset = "all",
  id_sort = FALSE,
  id_cols = get_subjid_cols(),
  time_unit = c("days", "weeks", "months", "years"),
  origin_fun = "min",
  aes_color = c("variable", "label"),
  plotly = getOption("edc_plotly", FALSE),
  id = "deprecated",
  id_lim = "deprecated",
  .lookup = "deprecated"
)
Arguments
- ...
not used
- include, exclude
a character vector of variables to exclude/include, in the form
dataset$column. Can be a regex (apart from$symbols that will be automatically escaped). Case-insensitive.- group
a grouping variable, given as "dataset$column".
- origin
a variable to consider as time 0, given as "dataset$column".
- data_list
a named list of data.frames to get the dates from. Default to get_datasets, which retrieve all raw datasets.
- id_subset
subjects to include in the plot. If numeric and
id_colsrefers to non-numeric values, treated as subject indices.- id_sort
whether to sort subjects by date (or time).
- id_cols
the subject identifiers columns. Identifiers be coerced as numeric if possible. See get_subjid_cols if needed.
- time_unit
if
origin!=NULL, the unit to measure time. One ofc("days", "weeks", "months", "years").- origin_fun
function to summarise the
origindate at the id level if needed. Should be named, or at least have a meaningful function name (see example "summarized origin".- aes_color
either
variable("{dataset} - {column}") orlabel(the column label).- plotly
whether to use
{plotly}to get an interactive plot.- id
deprecated
- id_lim
deprecated
- .lookup
deprecated
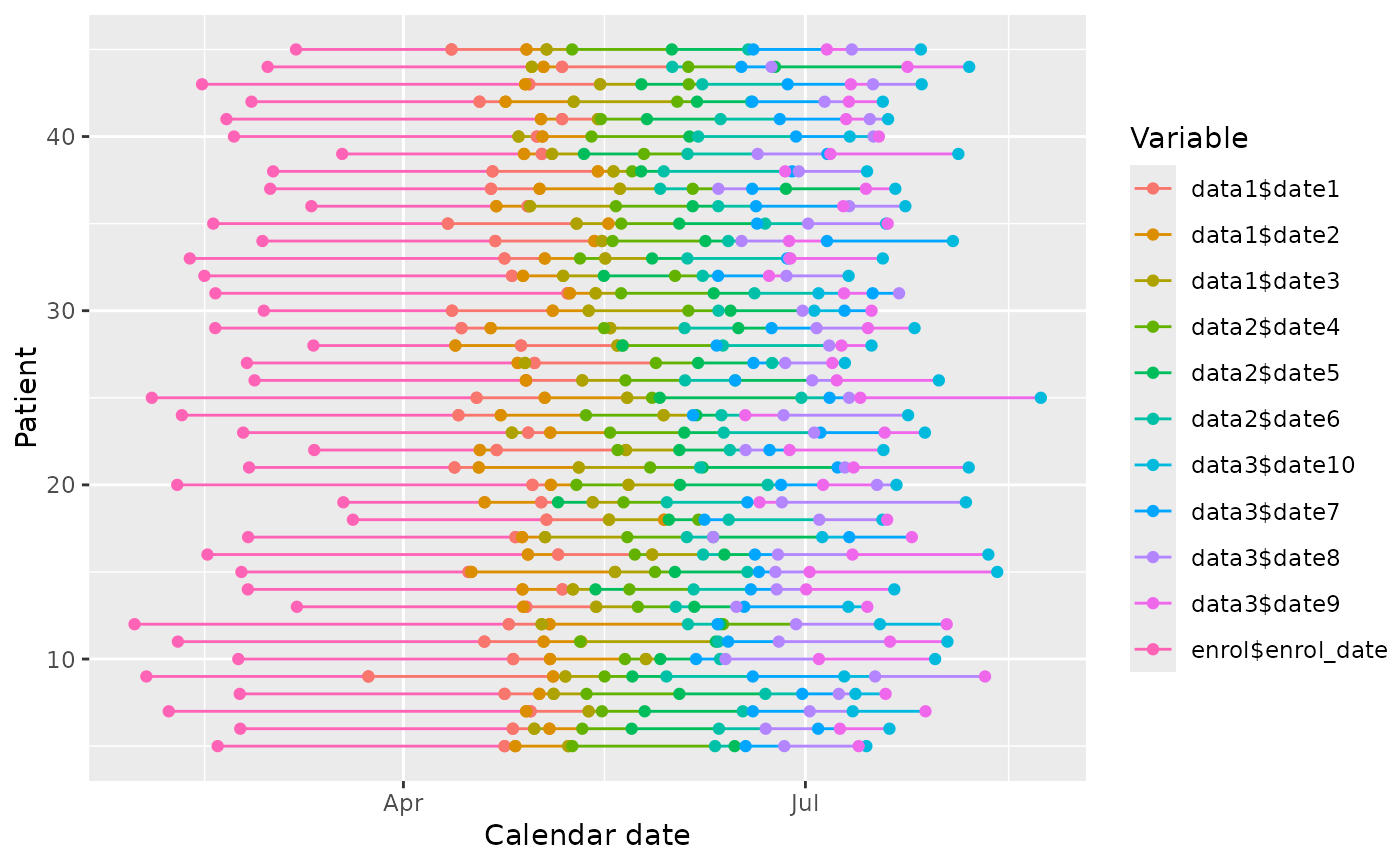
Examples
#db = read_trialmaster("filename.zip", pw="xx")
db = edc_example()
#> Warning: Option "edc_lookup" has been overwritten.
load_database(db)
edc_swimmerplot(id_lim=c(5,45))
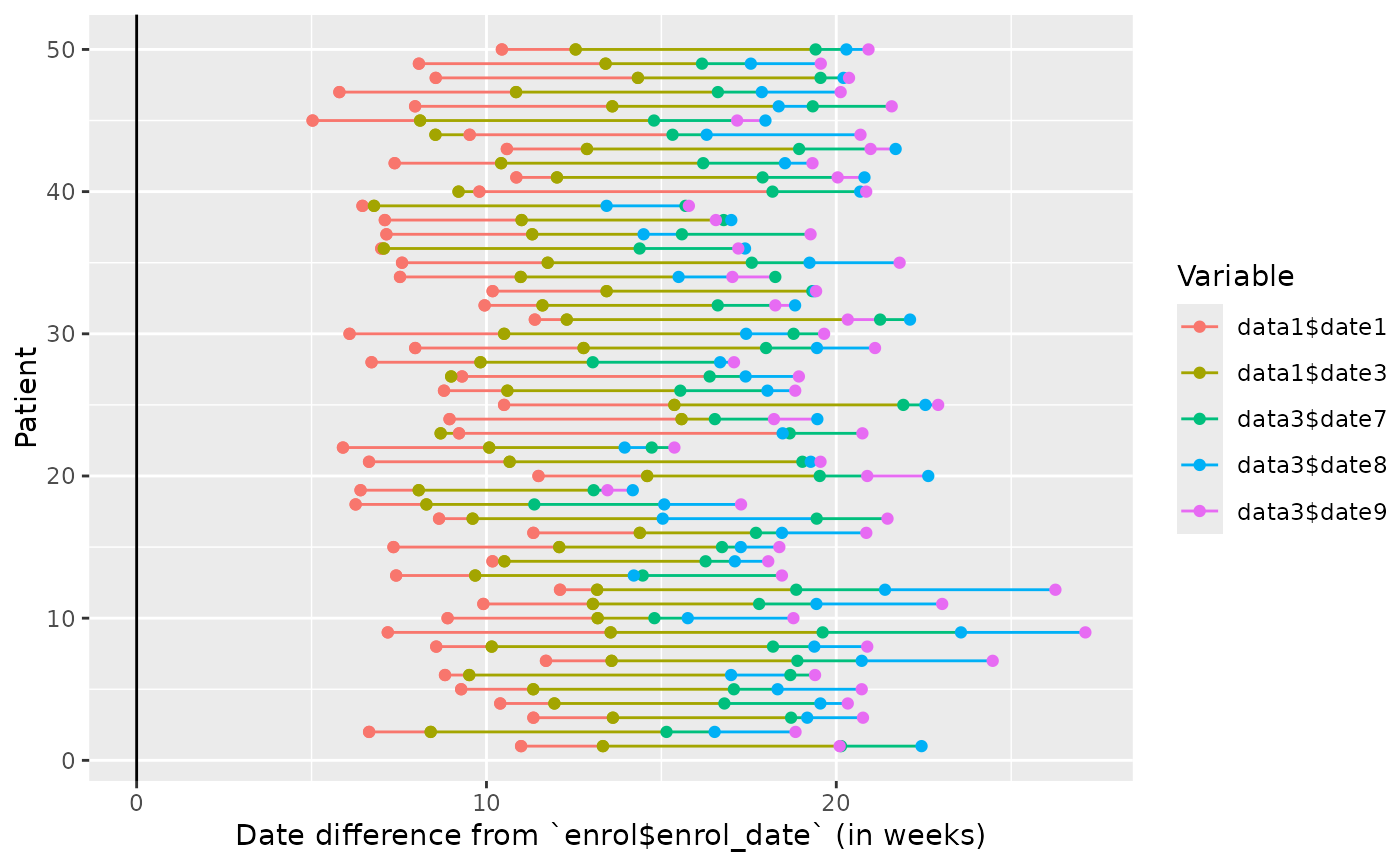
 #fixed origin
edc_swimmerplot(origin="enrol$enrol_date", time_unit="months",
include=c("data1", "data3"),
exclude=c("DATA1$DATE2", "data3$date\\d\\d"),
id_sort=TRUE)
#fixed origin
edc_swimmerplot(origin="enrol$enrol_date", time_unit="months",
include=c("data1", "data3"),
exclude=c("DATA1$DATE2", "data3$date\\d\\d"),
id_sort=TRUE)
 #summarised origin
edc_swimmerplot(origin="data1$date2", time_unit="months",
origin_fun=c("average"=~mean(.x, na.rm=TRUE)),
include=c("data1", "data3"),
exclude=c("DATA1$DATE2", "data3$date\\d\\d"),
id_sort=TRUE)
#summarised origin
edc_swimmerplot(origin="data1$date2", time_unit="months",
origin_fun=c("average"=~mean(.x, na.rm=TRUE)),
include=c("data1", "data3"),
exclude=c("DATA1$DATE2", "data3$date\\d\\d"),
id_sort=TRUE)
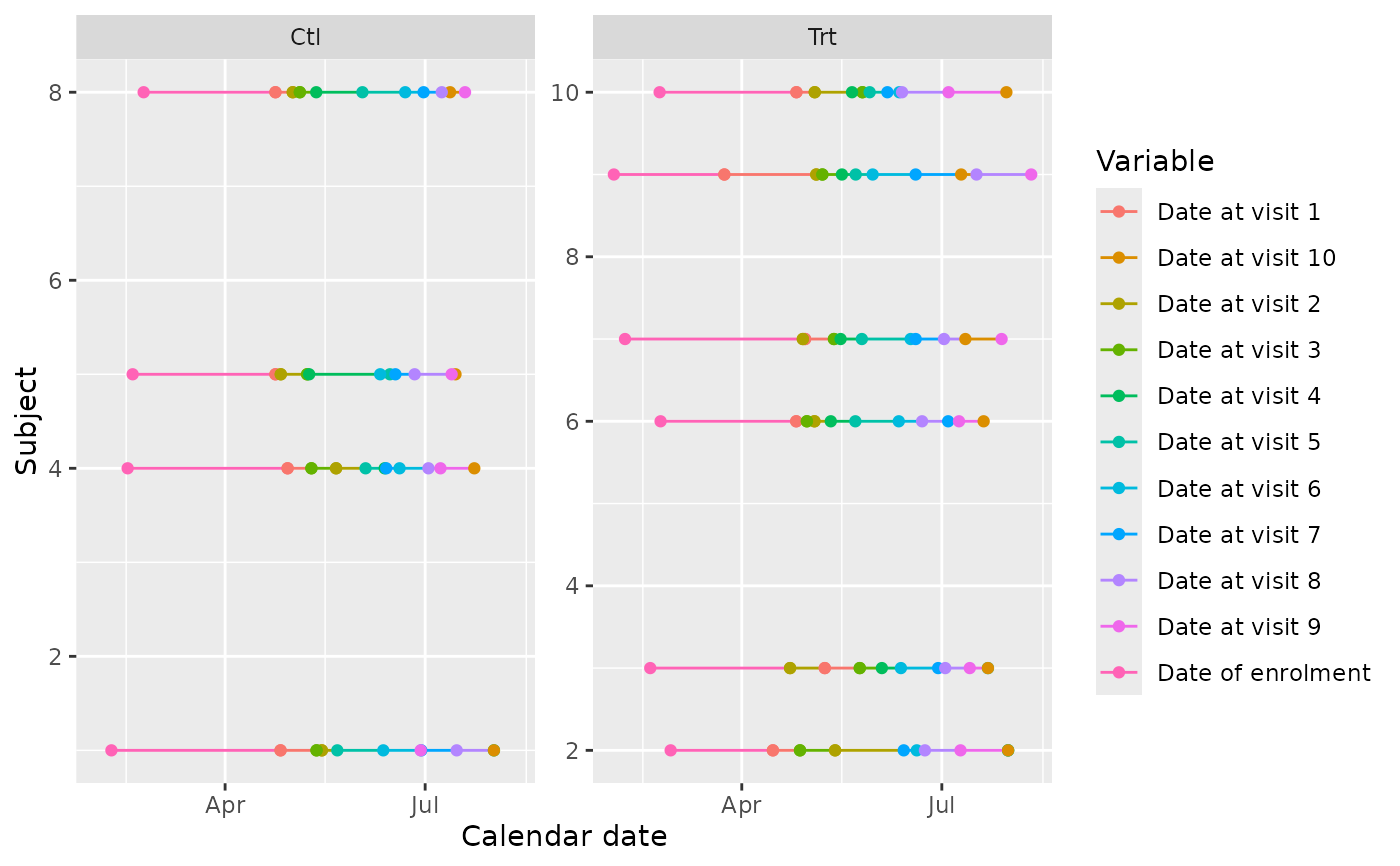
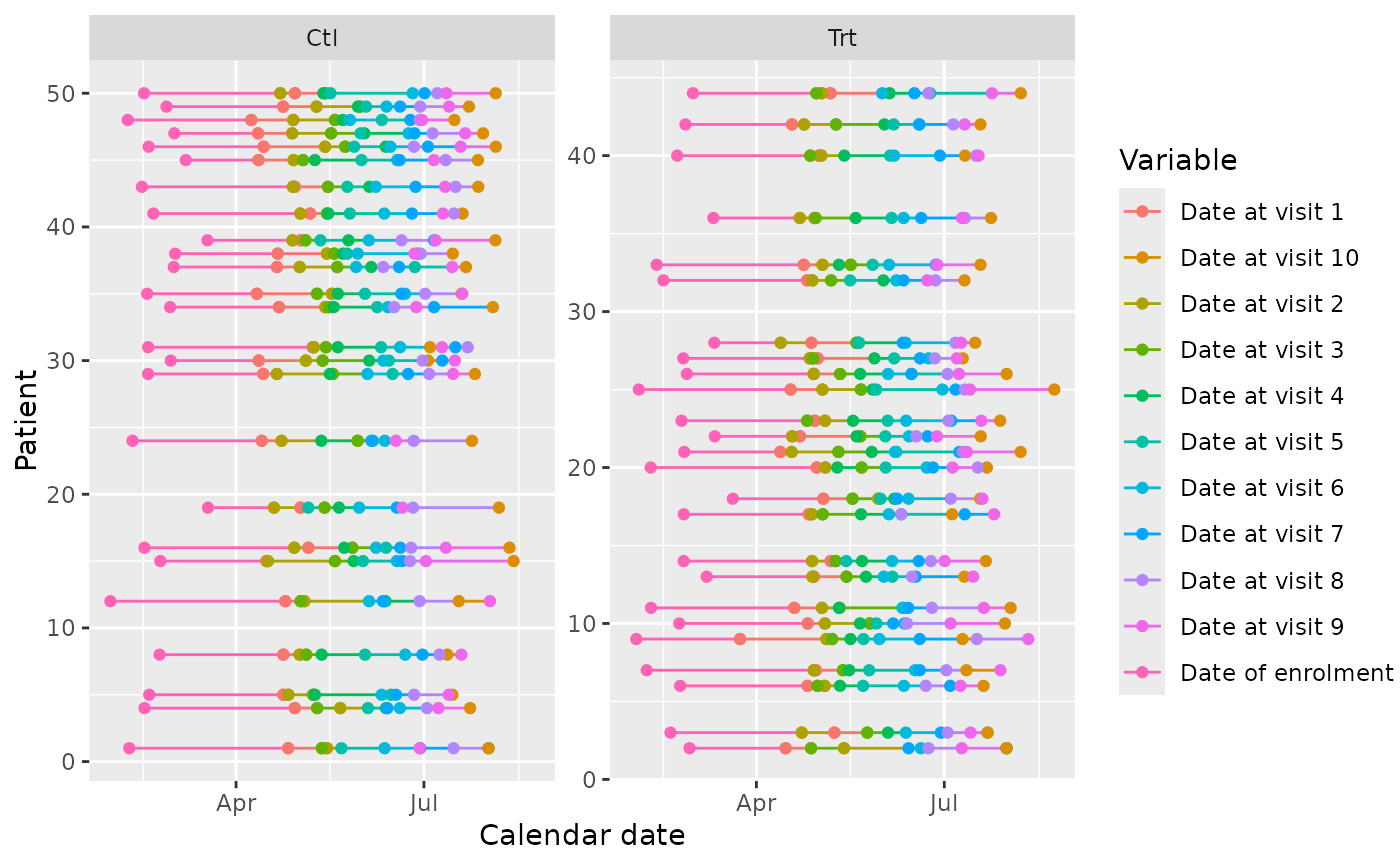 #id_subset
edc_swimmerplot(group="enrol$arm", id_subset=1:10, aes_color="label")
#id_subset
edc_swimmerplot(group="enrol$arm", id_subset=1:10, aes_color="label")
 if (FALSE) { # \dontrun{
p = edc_swimmerplot(plotly=TRUE)
save_plotly(p, "edc_swimmerplot.html")
} # }
if (FALSE) { # \dontrun{
p = edc_swimmerplot(plotly=TRUE)
save_plotly(p, "edc_swimmerplot.html")
} # }